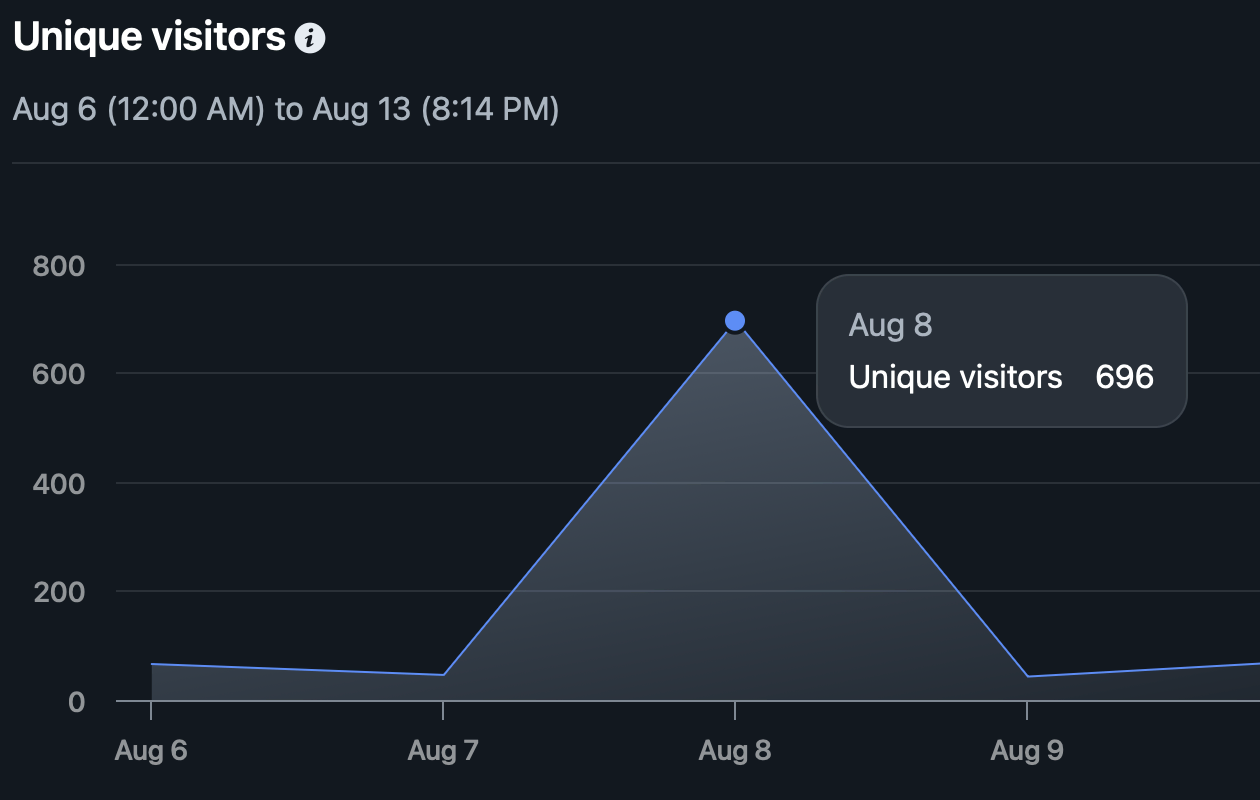
I was at DEF CON preparing for my upcoming talk “Don’t Cry Wolf - Evidence Based Assessments of ICS Threats” when I thought to log into my website’s hosting provider and check some traffic metrics. Expecting to see the usual meager statistic of 600 visitors in the last week, my jaw nearly dropped when I saw a surprising number: 350,000 visitors in about two hours.
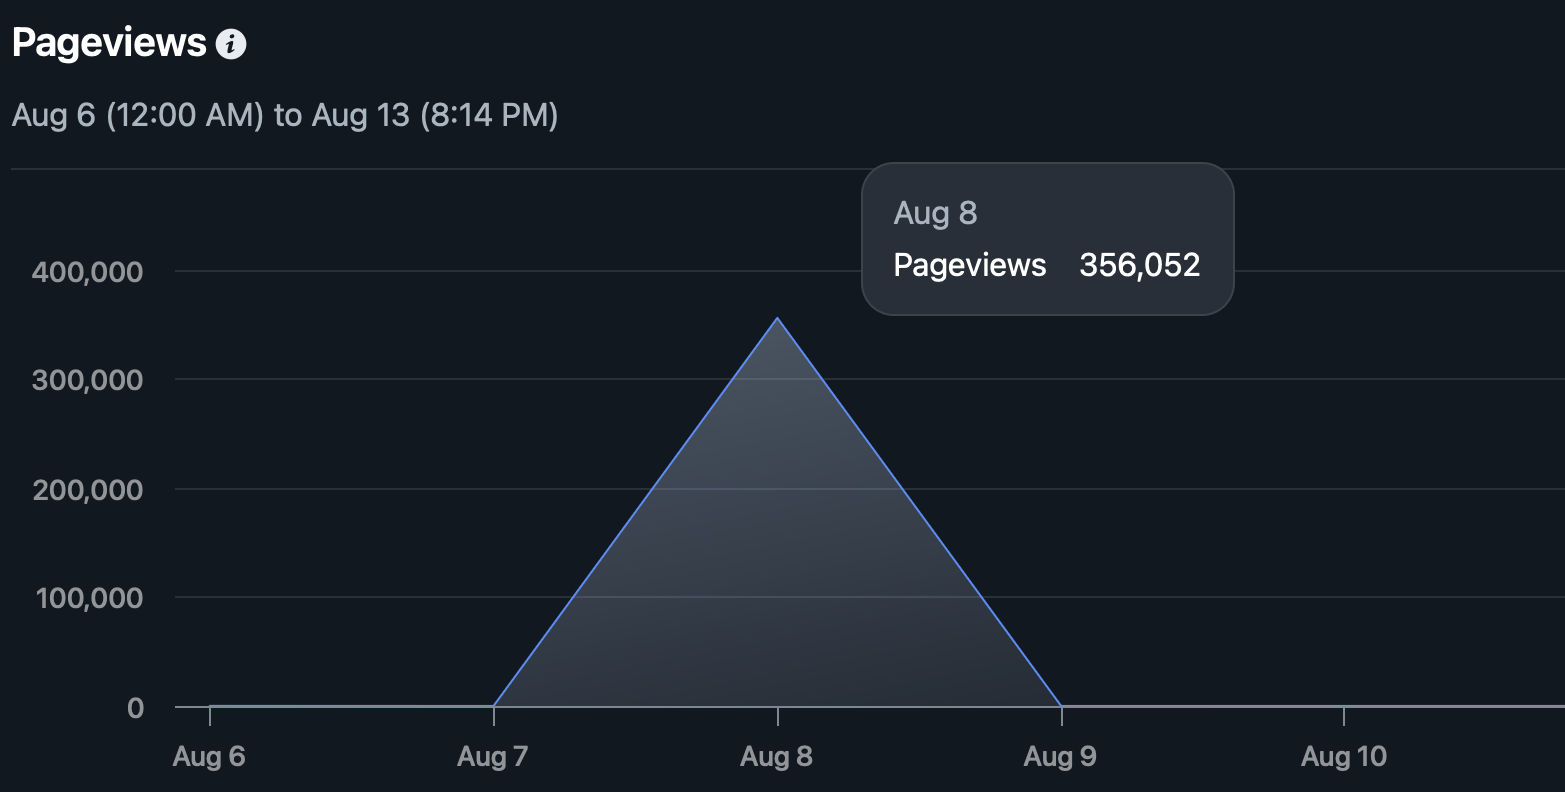
I checked the number of unique visitors and it was immediately suspicious. ~700 visitors for ~350,000 requests?
Data Collection and Dead Ends
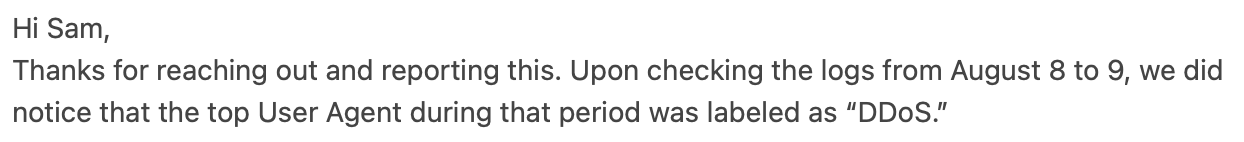
Unfortunately, my hosting provider does not automatically collect visitor information. Consequently, I had very little to initially investigate. However, I emailed Netlify, hoping they may have additional answers. They got back to me (s/o Netlify!) - and after some back and forth, they provided me with a list of the top 10 or so IP addresses by request count along with the top user agents.
| IP address | Request Count |
|---|---|
| 103.116.9.4 | 3989 |
| 213.194.64.194 | 3528 |
| 78.108.182.63 | 3121 |
| 51.79.166.152 | 2966 |
| 103.154.77.110 | 2598 |
| 103.154.77.104 | 2476 |
| 145.239.94.103 | 2280 |
| 170.81.241.14 | 2142 |
| 92.45.71.146 | 2070 |
| 85.163.10.163 | 2045 |
While the full list of 700 IPs would’ve been better, I gotta hand it to Netlify’s customer support. They were significantly more helpful than I had expected.
Unfortunately, I have not been able to tie this activity to any specific botnet. I would’ve considered the possibility of a poorly programmed, gone awry scanner as a explanation, but the DDoS user agent string certainly seems to indicate otherwise. Researchers or analysts who come across similar activity or overlaps with the above indicators - please reach out over LinkedIn.